I was going to write about avoiding dynamic memory allocations during parallel execution, but when I was profiling a test code I found a bug in _free_dbg which analysis consumed the time I had for this post, so I sidetracked a bit and I guess the initial topic will have to wait.
But basically, dynamic allocations is not something you should do in your game code if performance matters, especially during parallel execution. If the above seems obvious this post probably is not for you.
The other day I wanted to parallelize some serialization code, but the results in debug on Windows were mediocre at most. After some time I figured out that the main offender was _free_dbg, even though I preallocated all the memory before the serialization. But lets start from the beginning.
Imagine I have a class Foo, which represents my game object:
struct Foo
{
    bool _Boolean;
    float _FloatingPoint;
    // ...
};
I want to serialize those objects to a text buffer. Example implementation could look like this:
int Foo::SerializeAsText(char* Buffer) const
{
    int chars = sprintf(Buffer, "%s", _Boolean ? "y" : "n");
    chars += sprintf(Buffer + chars, "%.2f", _FloatingPoint);
    return chars;
}
Now I have my serialization in place and I want to profile it. To produce some reliable profiling data I need lots of objects, so I organized them into 1024 pages, every page containing 1024 objects.
template<typename T, int PageCount = 1024, int PageSize = 1024>
struct Storage
{
    std::vector<std::vector<T>> _Pages;
    // ...
}
This setup produces 1024*1024=1048576 objects, which should be enough for profiling.
Lets start from page by page serialization.
template<typename T, int PageCount = 1024, int PageSize = 1024>
struct Storage
{
    template<typename int (T::* Serializer)(char*)>
    void Serialize(char* Buffer)
    {
        for (const auto& Page : _Pages)
            for (const auto& Object : Page)
                Buffer += (Object.*Serializer)(Buffer);
    }
}
Page by page serialization takes 1015 milliseconds.
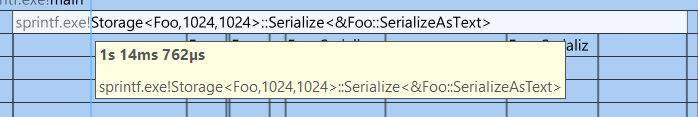
It is going to be my baseline.
Lets do the same, but with parallel_for iterating over pages of objects:
template<typename T, int PageCount = 1024, int PageSize = 1024>
struct Storage
{
    void SerializeParallel(char* Buffer)
    {
        std::for_each(std::execution::par_unseq, _Pages.data(), _Pages.data() + PageCount, [&](const std::vector<T>& Page)
            {
                const int Index = &Page - _Pages.data();
                char* LocalBuffer = Buffer + (Index * PageSize * T::SerializedSize);
                for (const auto& Object : Page)
                    LocalBuffer += (Object.*Serializer)(LocalBuffer);
            });
    }
}
As you can see there’s no dynamic memory allocation happening. The buffer is preallocated before calling SerializeParallel.
Serializing pages in parallel takes 561 milliseconds.
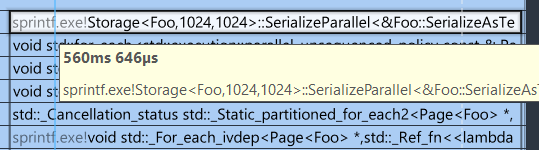
Better than the baseline, but given I’m running this on Intel i7-8750H with 12 logical cores available, it’s far from what I expected. I’m going to take a closer look at what the program is actually doing when serializing in parallel.
Starting from the thread utilization:

This doesn’t look good. There are lots of bubbles, where threads seem to idle or wait. I’m diving into call stacks to see where the bubbles come from just to find this:
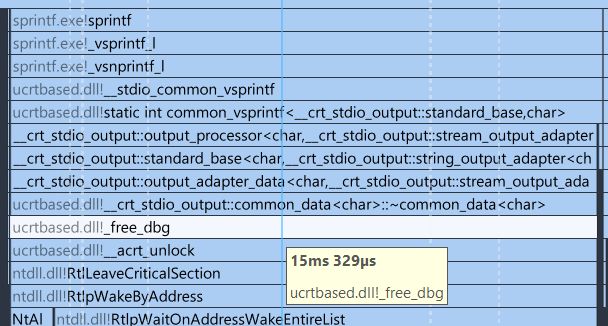
_free_dbg coming out of sprintf implementationIt looks that sprintf under the hood calls a _free_dbg which in turn triggers synchronization due to a lock. In the above screenshot the lock consumed 15 milliseconds! How many of those does the code hit?

A lot. Lets look at the numbers:

It seems that the serialization code spends 336 ms in locks (__acrt_lock). It is 60% time of Foo::SerializeAsText. Those numbers are crazy.
Calls to _free_dbg mean that sprintf probably dynamically allocates memory in some cases. I don’t think it does in this situation, because there are no corresponding calls to malloc. So why does it even show in the profiler? I guess because the caller assumes that calling free with a nullptr is a no-op (does nothing). But is it?
Let’s look into the Windows SDK code (10.0.19041.0):
// free.cpp
extern "C" _CRT_HYBRIDPATCHABLE __declspec(noinline) void __cdecl free(void* const block)
{
    #ifdef _DEBUG
    _free_dbg(block, _NORMAL_BLOCK);
    #else
    _free_base(block);
    #endif
}

// debug_heap.cpp
extern "C" __declspec(noinline) void __cdecl _free_dbg(void* const block, int const block_use)
{
    __acrt_lock(__acrt_heap_lock);
    __try
    {
        int const actual_use{block_use == _UNKNOWN_BLOCK && block != nullptr
            ? header_from_block(block)->_block_use
            : block_use};

        free_dbg_nolock(block, actual_use);
    }
    __finally
    {
        __acrt_unlock(__acrt_heap_lock);
    }
}

// free_base.cpp
extern "C" void __declspec(noinline) __cdecl _free_base(void* const block)
{
    if (block == nullptr)
    {
        return;
    }

    if (!HeapFree(select_heap(block), 0, block))
    {
        errno = __acrt_errno_from_os_error(GetLastError());
    }
}
Calling free(0) in release actually is a no-op, but in debug it evaluates to a _free_dbg which always locks, regardless of the argument. I’ve found a thread on Visual Studio Developer Community, where someone raised it as an issue two years ago. Hopefully it’ll be fixed one day.
Getting back to the serialization – I am not going to fix sprintf so that it doesn’t allocate memory, but there are bunch of alternatives out there. I’ve found nanoprintf from Charles Nicholson to be a good replacement. It’s a single header, lightweight implementation and does not allocate memory.
After replacing sprintf with npf_snprintf the profiler produces this output:
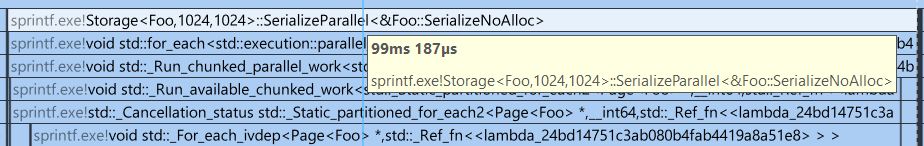
Thread utilization also looks nicer:

To sum this up – dynamic allocations in parallel execution are bad for performance as they lead to thread synchronization. You should strive to use preallocated memory and even then profile your code regularly to spot potential locks coming out of external libraries.
You should also be careful about overusing printf-family functions in parallel code, as they might allocate memory and will always make a call to free (even with a nullptr) which currently triggers a lock on Windows when compiling in debug configuration.